GUI applications#
GUI applications are packaged as rotsim2d_apps, separate from the main library. Install them with:
pip install rotsim2d_apps
These applications are mostly matplotlib plots controlled by Qt widgets.
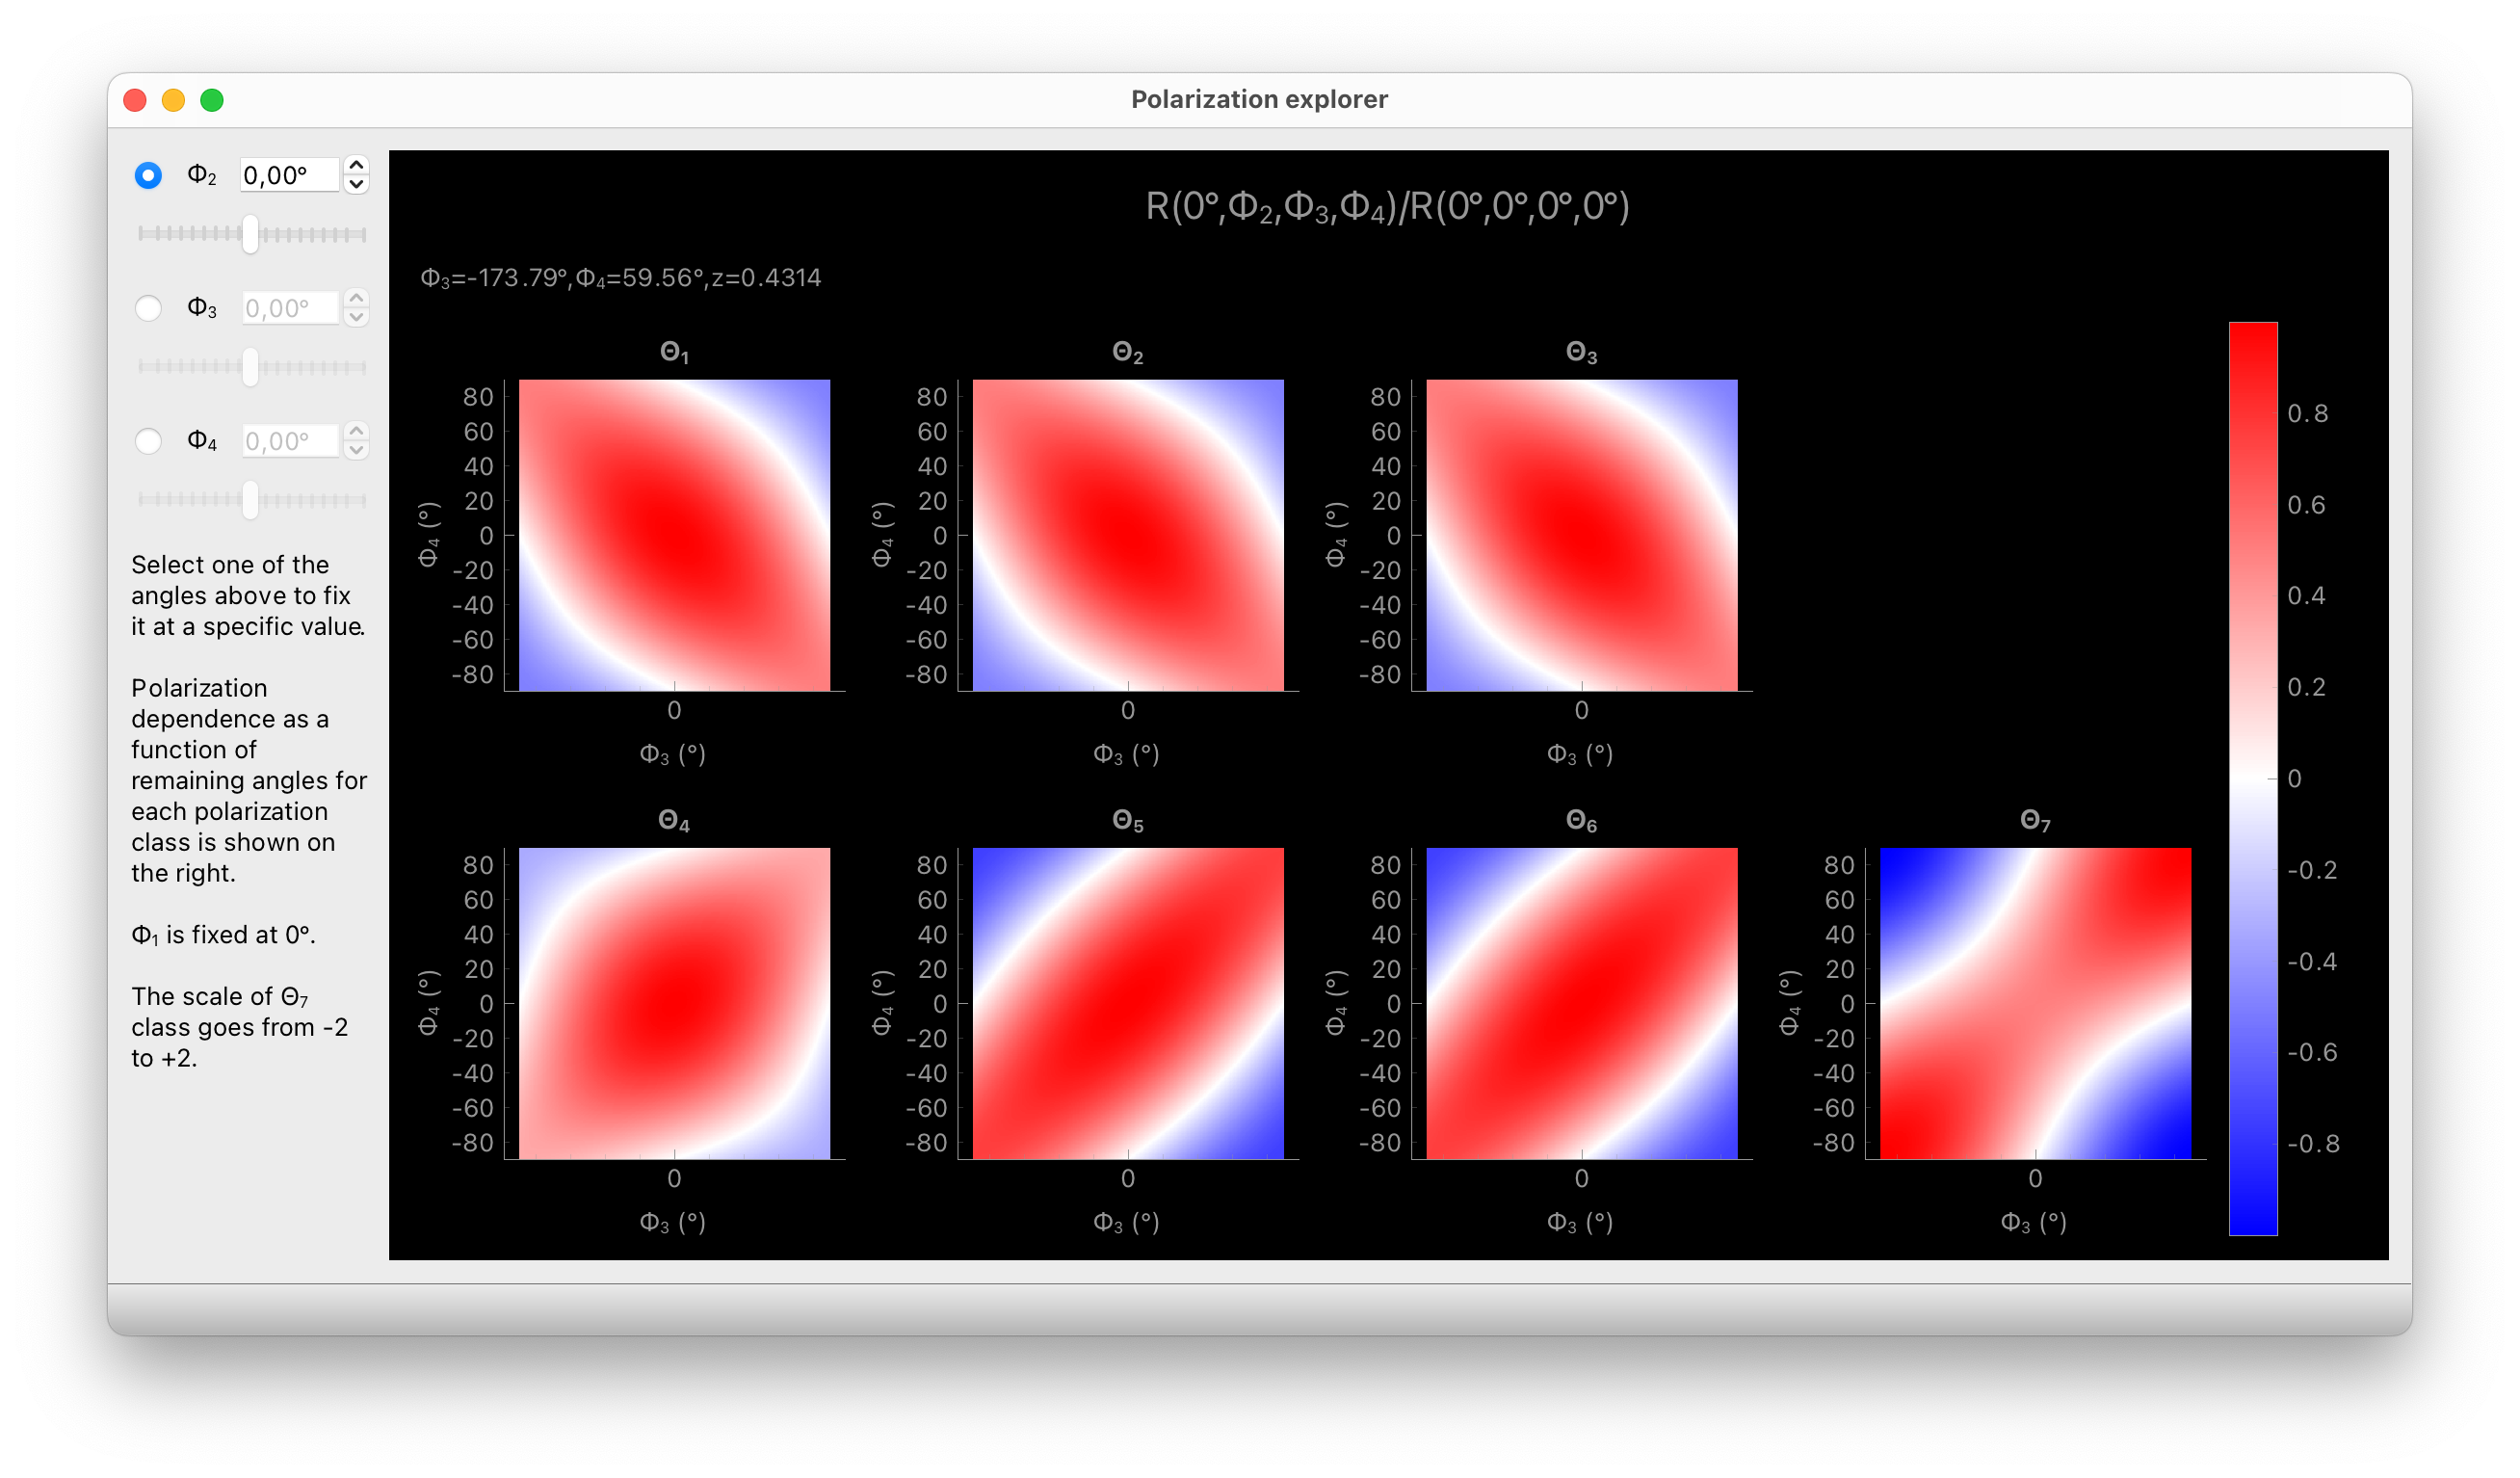
rotsim2d_polarizations, shows values of all 7 R-factors in the high-J limit as a function of polarization angles. To reduce dimensionality, the first angle is always set to zero and the user can select which of the remaining three angles is fixed. The dependence on the last two angles is shown as 2D images.
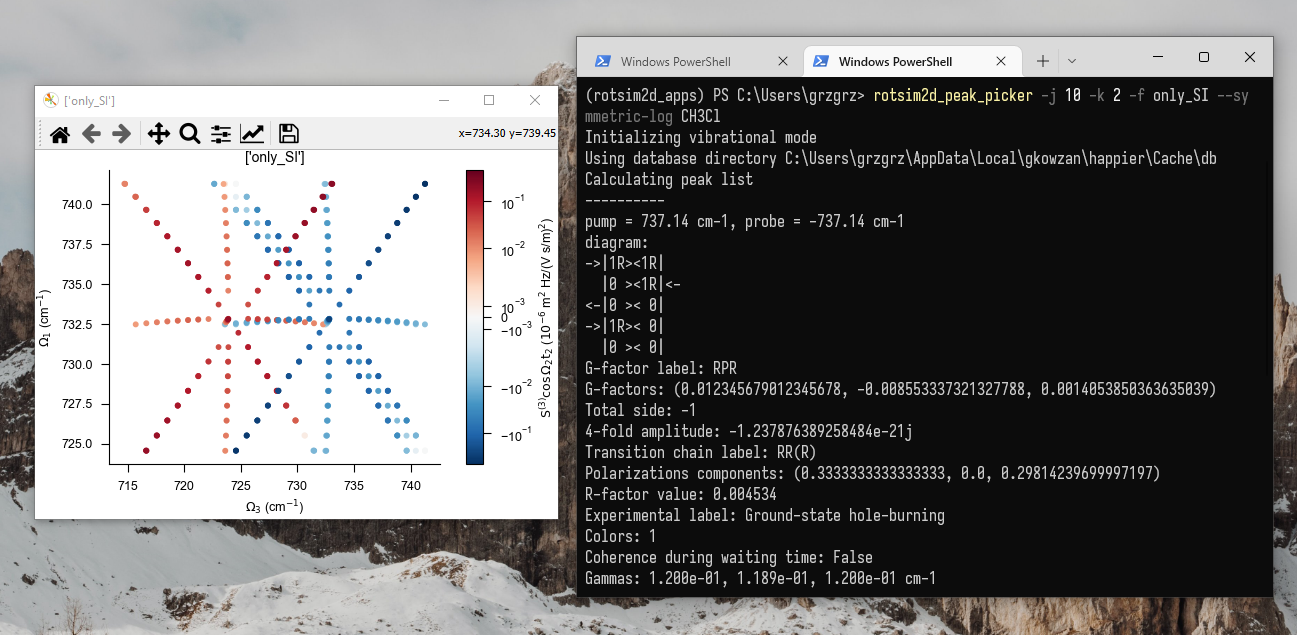
rotsim2d_peak_picker, shows scatter plot of third-order pathway intensities, clicking on a peak will print out information about pathways contributing to the peak.
For example:
rotsim2d_peak_picker -f only_SII --symmetric-log CO
will plot CO intensities phase-matched in SII direction, plotted with symmetric logarithmic scale.:
rotsim2d_peak_picker -j 10 -k 2 -f only_SI --symmetric-log CH3Cl
will plot CH3Cl intensities for J up to 10 and K up to 2, phase-matched in SI direction, using symmetric logarithmic scale.
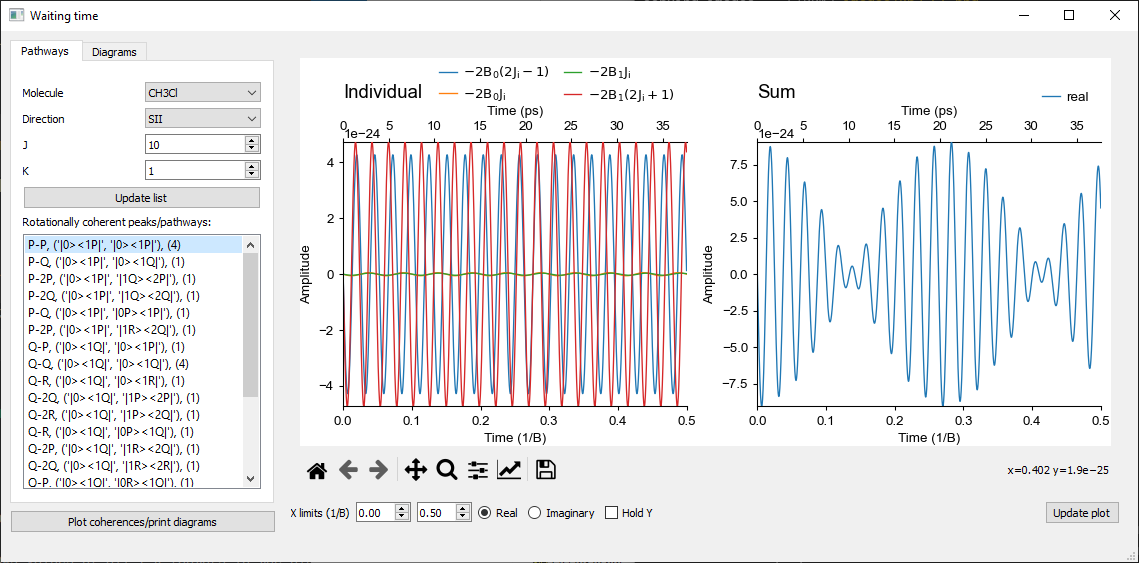
rotsim2d_waiting_time, investigate waiting time dependence.